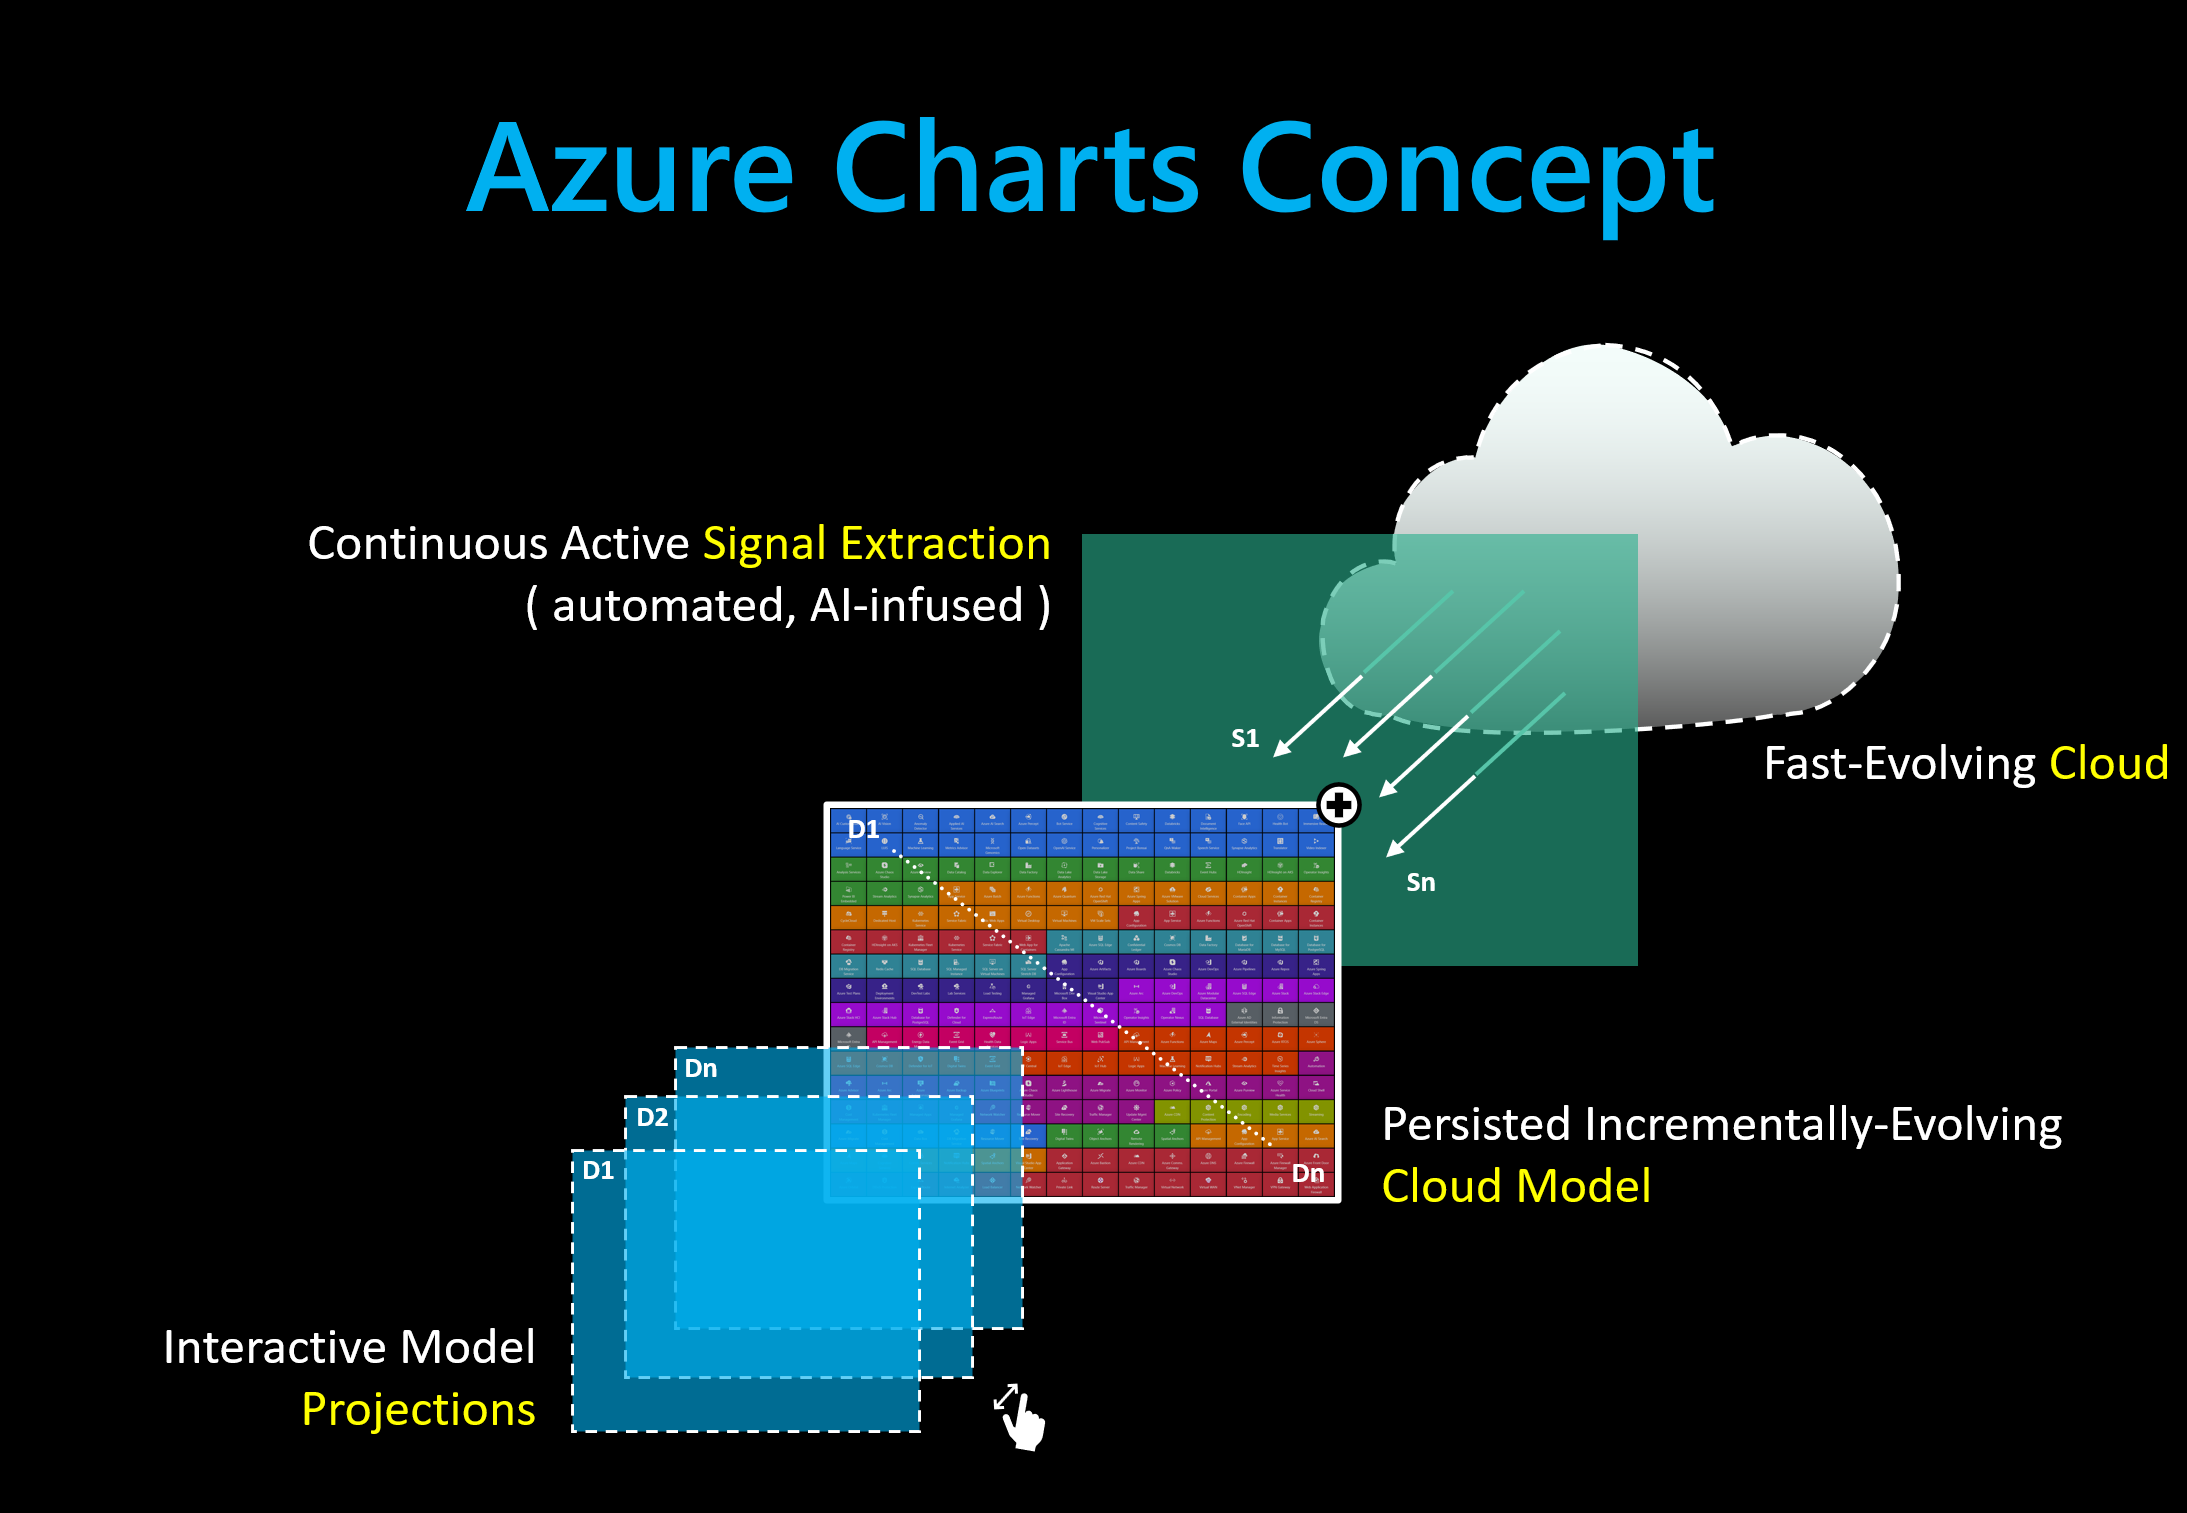
What is Azure Charts?
Positioning |
: |
Live visual exploration environment for Azure Cloud and ecosystem. |
Mission |
: |
Communicating Azure's current state, structure, updates, and ecosystem in a compact digestible way. |
Concept |
: |
Cloud Charts Manifesto |
Data sources |
: |
Content and feeds from Microsoft.com, YouTube.com, StackOverflow.com, GitHub.com and GPT models. |
While developed by a Microsoft employee, Azure Charts is not a Microsoft service or product. This is a personal project, there are no implicit or explicit obligations related to it.
The service is not covered by any SLA. If you want to receive updates about Azure Charts, feel free to follow or connect on LinkedIn.


How does Azure Charts deliver value while evolving fast with low maintenance overhead?
It's all about cloud automation. Data acquisition is automated with Azure Functions, code delivery is automated with Azure DevOps, monitoring and performance management is automated with Azure App Insights and Azure Monitor.
